prometheus
搞懂prometheus,架构原理,源码分析,及项目实战。 promethues源码版本针对 2.37.1 最新的lts版本 。
简介及架构原理
Prometheus由go语言开发, 是一套开源的监控&报警&时间序列数据库的组合。
通过http call 从配置文件指定的 网络端点(endpoint) 周期性 抓取 指标数据。
k8s也带动了它的发展。适合监控容器平台。 是cncf成员。
https://prometheus.io/docs/introduction/overview/
架构
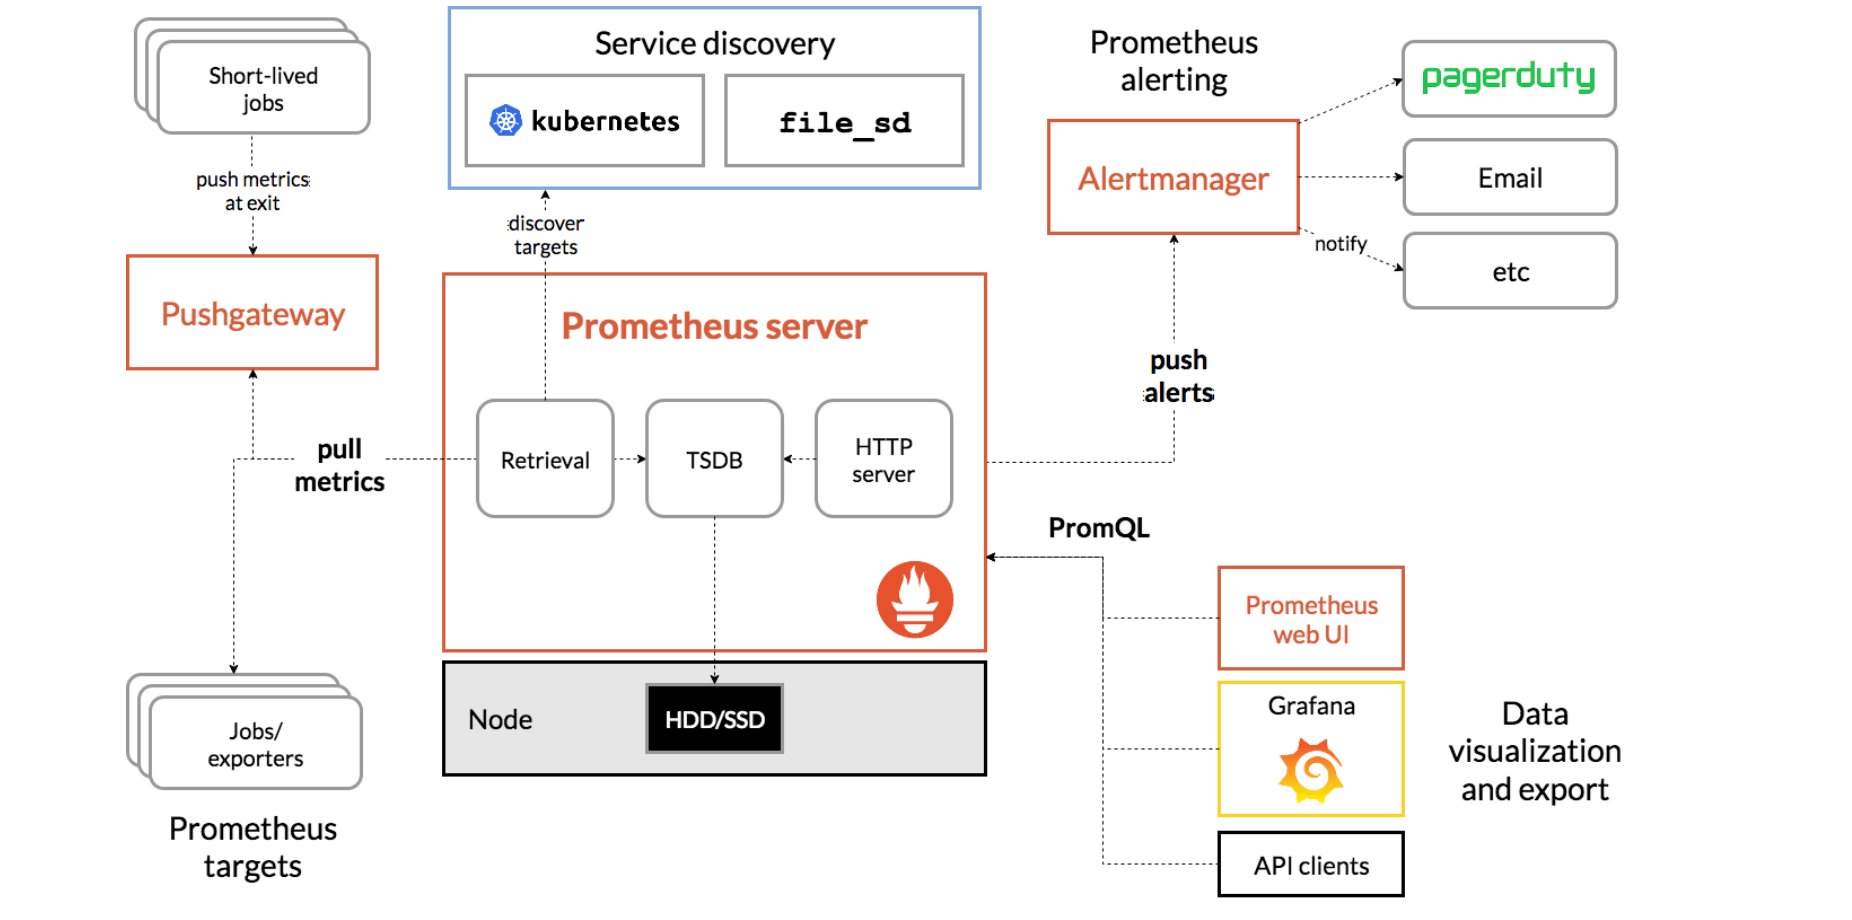
Prometheus 服务器 Prometheus Server 是 Prometheus组件中的核心部分,负责实现对监控数据的获取,存储以及查询。
NodeExporter 业务数据源 Prometheus Server pull 数据。 可以是 有个pushgateway,可以使push到有个pushgateway,Prometheus Server再去pull。
AlertManager 报警管理器 Prometheus 通过配置报警规则,如果符合报警规则,那么就将报警推送到 AlertManager,由其进行报警处理。
可视化监控界面 Prometheus 收集到数据之后,由 WebUI 界面进行可视化图标展示。目前我们可以通过自定义的 API 客户端进行调用数据展示,也可以直接使用 Grafana 解决方案来展示。
时序数据简介
时间序列数据(TimeSeries Data) : 按照时间顺序记录系统、设备状态变化的数据被称为时序数据.
应用的场景很多, 如:
- 无人驾驶车辆运行中要记录的经度,纬度,速度,方向,旁边物体的距离等等。每时每刻都要将数据记录下来做分析。
- 某一个地区的各车辆的行驶轨迹数据
- 传统证券行业实时交易数据
- 实时运维监控数据等
时间序列数据库的主要优点:
- 性能好
关系型数据库对于大规模数据的处理性能糟糕。NOSQL可以比较好的处理大规模数据,让依然比不上时间序列数据库。
- 存储成本低
高效的压缩算法,节省存储空间,有效降低IO
Prometheus有着非常高效的时间序列数据存储方法,每个采样数据仅仅占用3.5byte左右空间,上百万条时间序列,30秒间隔,保留60天,大概花了200多G(来自官方数据)
Prometheus的主要特征
-
多维度数据模型
-
灵活的查询语言
-
不依赖分布式存储,单个服务器节点是自主的
-
以HTTP方式,通过pull模型拉去时间序列数据
-
也可以通过中间网关支持push模型, pushgateway, prometheus再去pushgateway 拉取
-
通过服务发现或者静态配置, 来发现目标服务对象
-
支持多种多样的图表和界面展示
结合生态内的其他组件 ,pushgateway、altermanager、grafana 等构成一个完整的it 监控系统
三种途径抓取指标数据
-
exporters
通过预制好的exporters
-
Instrumentation.
应用程序暴露一个url ,给promethues获得数据
-
pushgateway
promethus去 抓去 pushgateway 的数据, 应用程序把指标push给 pushgateway
pull 模型的优点
集中控制,配置集中在prometheus 中,包括采集指标及采集速率
prometheus不是一款事件驱动的存储系统
二进制安装prometheus
下载
1sudo mkdir -p /opt/app
2cd /opt/app
3sudo wget https://github.com/prometheus/prometheus/releases/download/v2.37.1/prometheus-2.37.1.linux-amd64.tar.gz
4sudo tar zxvf prometheus-2.37.1.linux-amd64.tar.gz  # 2.37.1 是lts 版本
5sudo mv prometheus-2.37.1.linux-amd64 prometheus
6cd prometheus
7sudo mkdir data # 数据存储目录 /opt/app/prometheus/data
配置 system service
1sudo groupadd prometheus
2sudo useradd -g prometheus -M -s /sbin/nologin prometheus
3# 改data 目录 的 用户、组。不然起不起来,写不进去的
4sudo chown -R prometheus:prometheus  /opt/app/prometheus/data
5sudo vim /etc/systemd/system/prometheus.service
6#内容如下
 1[Unit]
 2Description=Prometheus Server
 3Documentation=https://prometheus.io/docs/introduction/overview/
 4After=network-online.target
 5[Service]
 6# 账户和组设置,可以保证数据安全
 7User=prometheus
 8Type=simple
 9ExecStart=/opt/app/prometheus/prometheus \
10    --config.file=/opt/app/prometheus/prometheus.yml \
11    --storage.tsdb.path=/opt/app/prometheus/data/ \
12    --web.console.templates=/opt/app/prometheus/consoles \
13    --web.console.libraries=/opt/app/prometheus/console_libraries \
14    --web.enable-lifecycle
15# web.enable-lifecycle 热更新
16Restart=on-failure
17RestartSecs=5s
18SuccessExitStatus=0
19LimitNOFILE=655360
20StandardOutput=syslog
21StandardError=syslog
22SyslogIdentifier=prometheus
23ExecReload=/bin/kill -HUP $MAINPID
24[Install]
25WantedBy=multi-user.target
 1sudo systemctl daemon-reload
 2sudo systemctl enable prometheus #开机启动
 3sudo systemctl start prometheus
 4# sudo systemctl stop prometheus
 5sudo systemctl status prometheus
 6
 7
 8# 查看端口 进程 日志
 9ss -ntlp |grep 9090
10ps -ef |grep prometheus |grep -v grep
配置域名
monitor.xxx.com.conf 配置如下
 1upstream blprometheus{
 2    server `ip or hostname`:9090;
 3}
 4
 5server {
 6        listen 80;
 7        server_name monitor.xxx.com;
 8         add_header  Access-Control-Allow-Origin *;
 9         add_header  Access-Control-Allow-Methods HEAD,OPTIONS,GET,POST,PUT,DELETE;
10         add_header  Access-Control-Allow-Headers Content-Type,Server,Date,Content-Length,Cache-Control,Keep-Alive,Connection,X-Requested-With,X-Request-Id,X-File-Name,Origin,Accept;
11         add_header  Access-Control-Max-Age 1728000;
12         underscores_in_headers on; #header 下划线 可以传递
13
14     location ~ ^/ {
15        #proxy_next_upstream  error timeout http_502 http_503 http_504;
16        proxy_cache off;
17        proxy_pass_header server;
18        proxy_set_header host $http_host;
19        proxy_redirect off;
20        proxy_set_header X-Forwarded-For $proxy_add_x_forwarded_for;
21        proxy_set_header x-real-ip $remote_addr;
22        proxy_set_header x-scheme $scheme;
23        proxy_pass http://blprometheus;
24    }
25}
ui 页面介绍
graph 下的
-
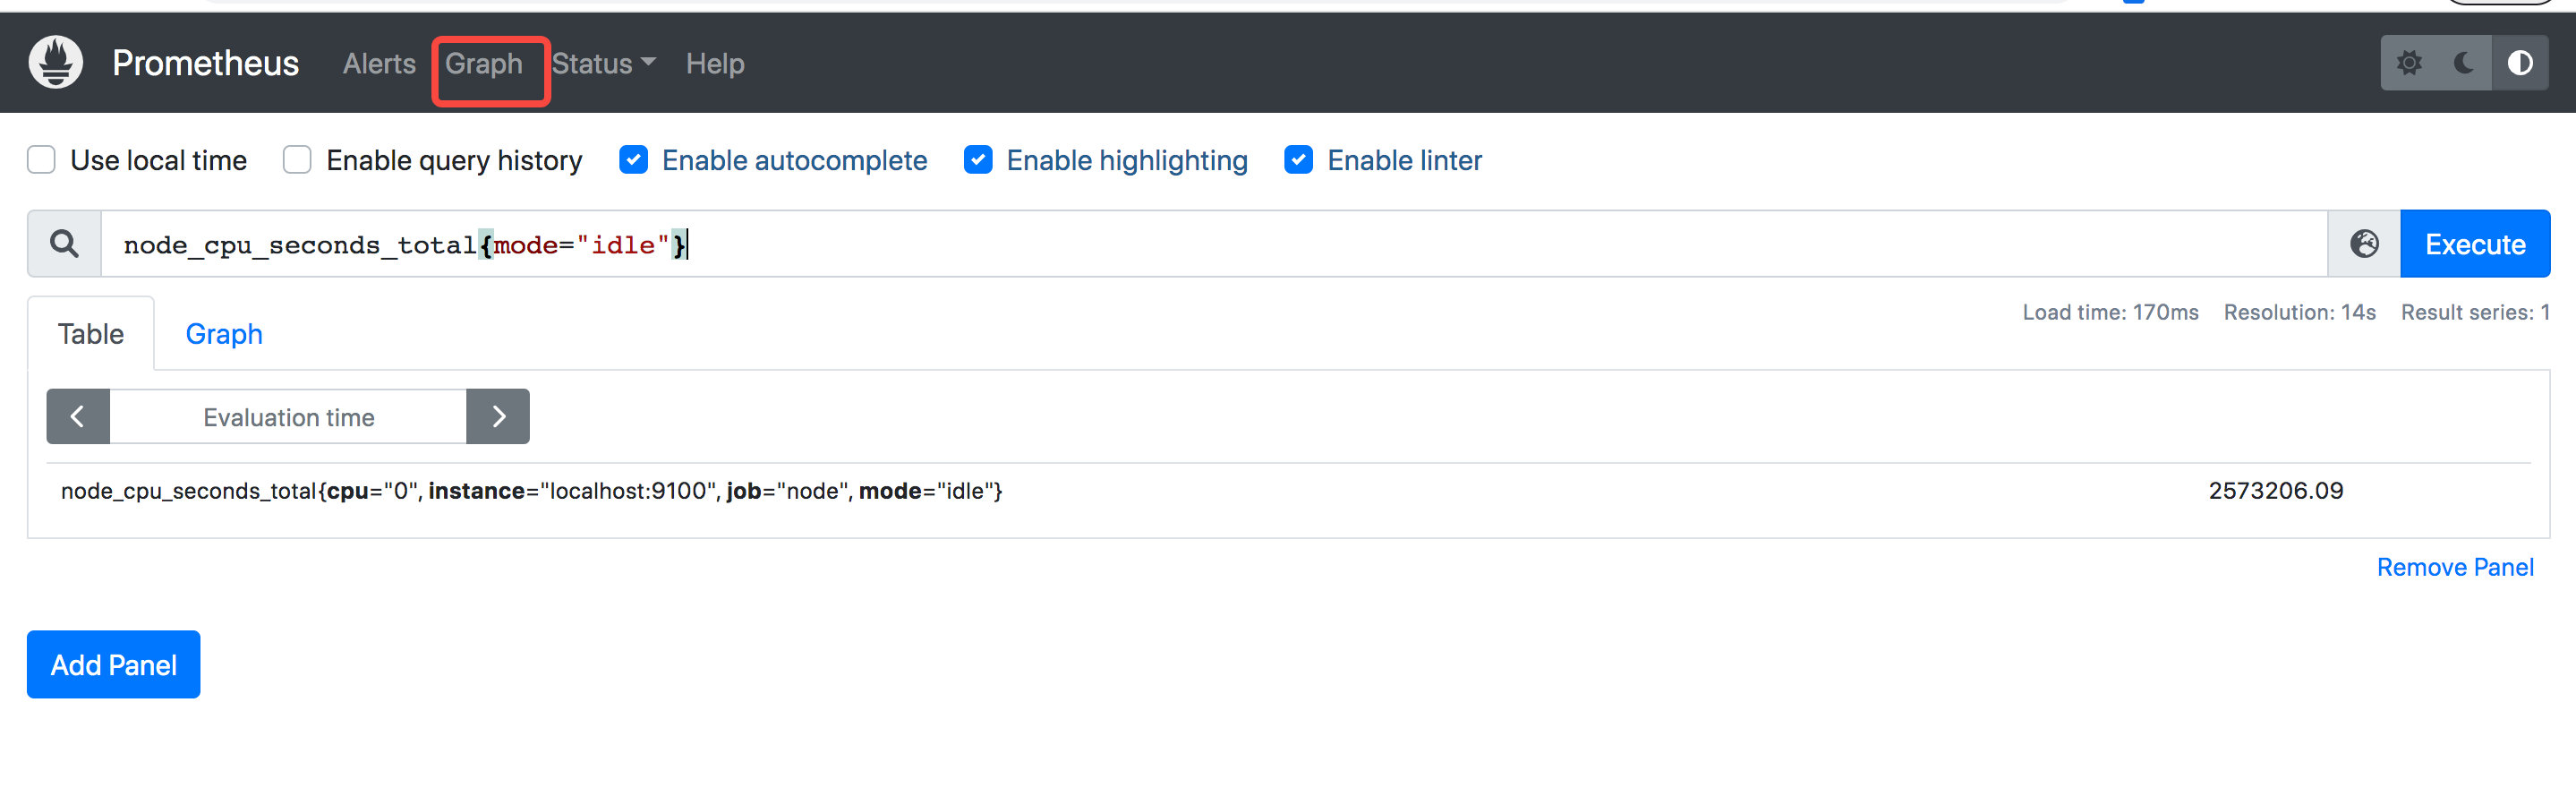
table查询 instante查询, 一个点的查询
-
Load time: 275ms 查询用时
-
Resolution: 14s 多少时间一个点 ,也叫分辨率
-
Result series: 1 查结果数
staus menu下的
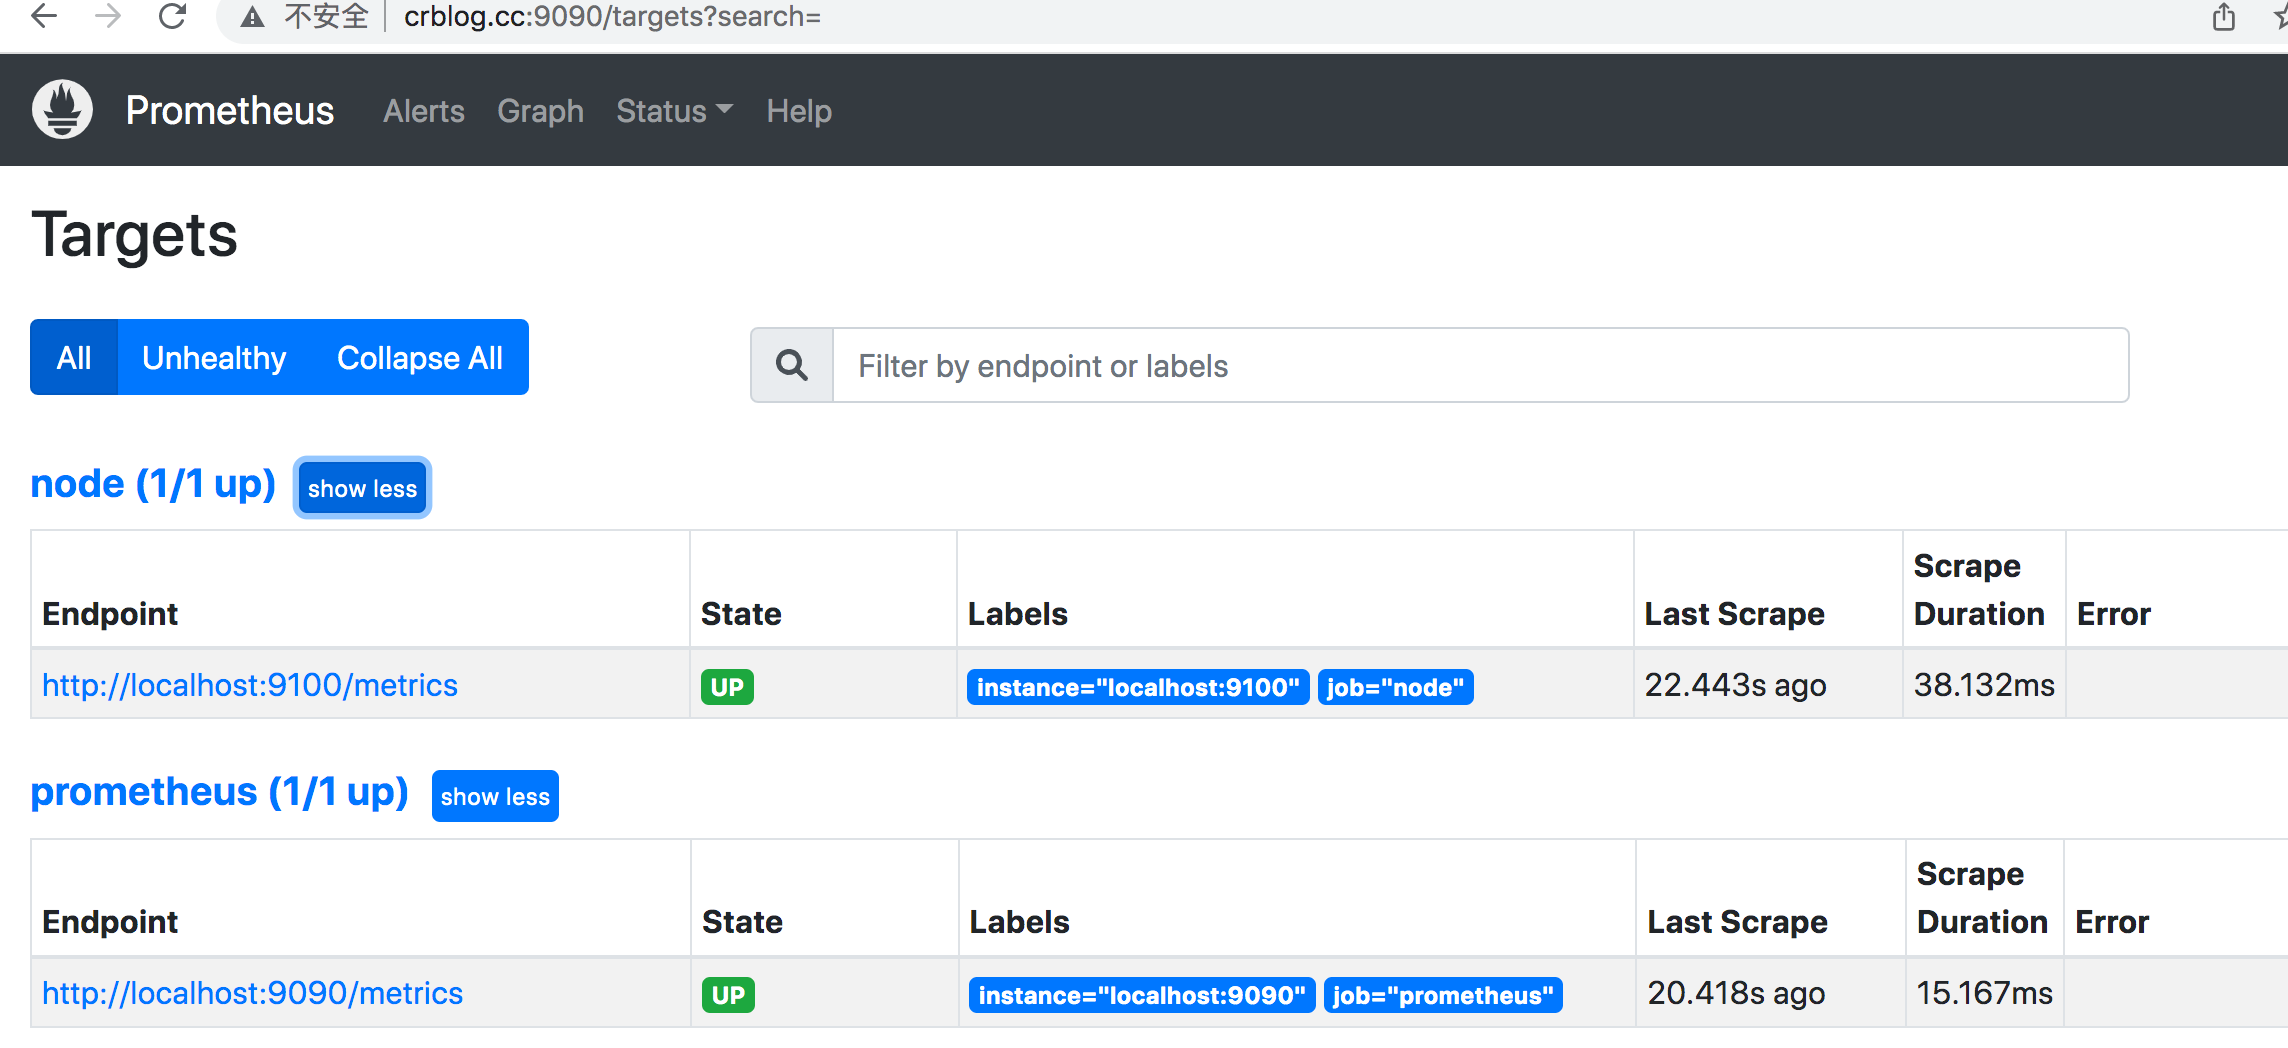
- status.targets页面 展示采集任务的
- status.command-line flags 页面 命令行参数
- status.runtime &build info 页面 编译信息和运行信息
- Storage retention 15d 数据默认保存15天
- status.tsdb-status页面 存储信息
- status. Service Discovery 服务发现页面
prometheus配置文件解析
6个配置大段
 1
 2# 全局配置段
 3global:
 4  # 采集间隔
 5  scrape_interval:     15s # Set the scrape interval to every 15 seconds. Default is every 1 minute.
 6  # 计算报警和预聚合间隔
 7  evaluation_interval: 15s # Evaluate rules every 15 seconds. The default is every 1 minute.
 8  # 采集超时时间
 9  scrape_timeout: 10s
10  # 查询日志,包含各阶段耗时统计
11  query_log_file: /opt/logs/prometheus_query_log
12  # 全局标签组
13  # 通过本实例采集的数据都会叠加下面的标签
14  external_labels:
15    account: 'huawei-main'
16    region: 'beijng-01'
17
18
19# Alertmanager信息段
20alerting:
21  alertmanagers:
22  - scheme: http
23    static_configs:
24    - targets:
25      - "localhost:9093"
26
27# 告警、预聚合配置文件段
28rule_files:
29    - /etc/prometheus/rules/record.yml
30    - /etc/prometheus/rules/alert.yml
31
32# 采集配置段
33scrape_configs:
34  # The job name is added as a label `job=<job_name>` to any timeseries scraped from this config.
35  - job_name: 'prometheus'
36
37    # metrics_path defaults to '/metrics'
38    # scheme defaults to 'http'.
39
40    static_configs:
41    - targets: ['localhost:9090']
42
43# 远程查询段
44remote_read:
45  # prometheus
46  - url: http://prometheus/v1/read
47    read_recent: true
48
49  # m3db
50  - url: "http://m3coordinator-read:7201/api/v1/prom/remote/read"
51    read_recent: true
52
53# 远程写入段
54remote_write:
55  - url: "http://m3coordinator-write:7201/api/v1/prom/remote/write"
56    queue_config:
57      capacity: 10000
58      max_samples_per_send: 60000
59    write_relabel_configs:
60      - source_labels: [__name__]
61        separator: ;
62        # 标签key前缀匹配到的drop
63        regex: '(kubelet_|apiserver_|container_fs_).*'
64        replacement: $1
65        action: drop
不同配置段组合的用途
| 对应的配置段 | 用途 |
|---|---|
| 采集配置段 | 做采集器,数据保存在本地 |
| 采集配置段 + 远程写入段 | 做采集器+传输器,数据保存在本地+远端存储 |
| 远程查询段 | 做查询器,查询远端存储数据 |
| 采集配置段 + 远程查询段 | 做采集器+查询器,查询本地数据+远端存储数据 |
| 采集配置段 + Alertmanager信息段 + 告警配置文件段 | 做采集器+告警触发器,查询本地数据生成报警发往Alertmanager |
| 远程查询段 + Alertmanager信息段 + 告警配置文件段 | 做远程告警触发器,查询远端数据生成报警发往Alertmanager |
| 远程查询段+远程写入段 + 预聚合配置文件段 | 查询远程,做预聚合指标,生成的结果集指标写入远端存储 |
基本概念
Point 数据点
源码位置 promql/value.go
1// Point represents a single data point for a given timestamp.
2// If H is not nil, then this is a histogram point and only (T, H) is valid.
3// If H is nil, then only (T, V) is valid.
4type Point struct {
5	T int64
6	V float64
7	H *histogram.FloatHistogram
8}
- 具体含义: 一个时间戳和一个value组合成的数据点
- size:16byte: 包含 1个8byte int64时间戳和1个8byte float64 value
Label 标签
源码位置: model/labels/labels.go
1// Label is a key/value pair of strings.
2type Label struct {
3Name, Value string
4}
go_goroutines{instance=“localhost:9090”, job=“prometheus”}
instance=“localhost:9090”
job=“prometheus”
Labels 标签组
go_goroutines{instance=“localhost:9090”, job=“prometheus”}
Labels的切片
 1type Labels []Label
 2[]Label{
 3	{
 4		Name:"instance",
 5		Value:"localhost:9090"
 6    },
 7	{
 8    Name:"job",
 9    Value:"prometheus"
10    }
11}
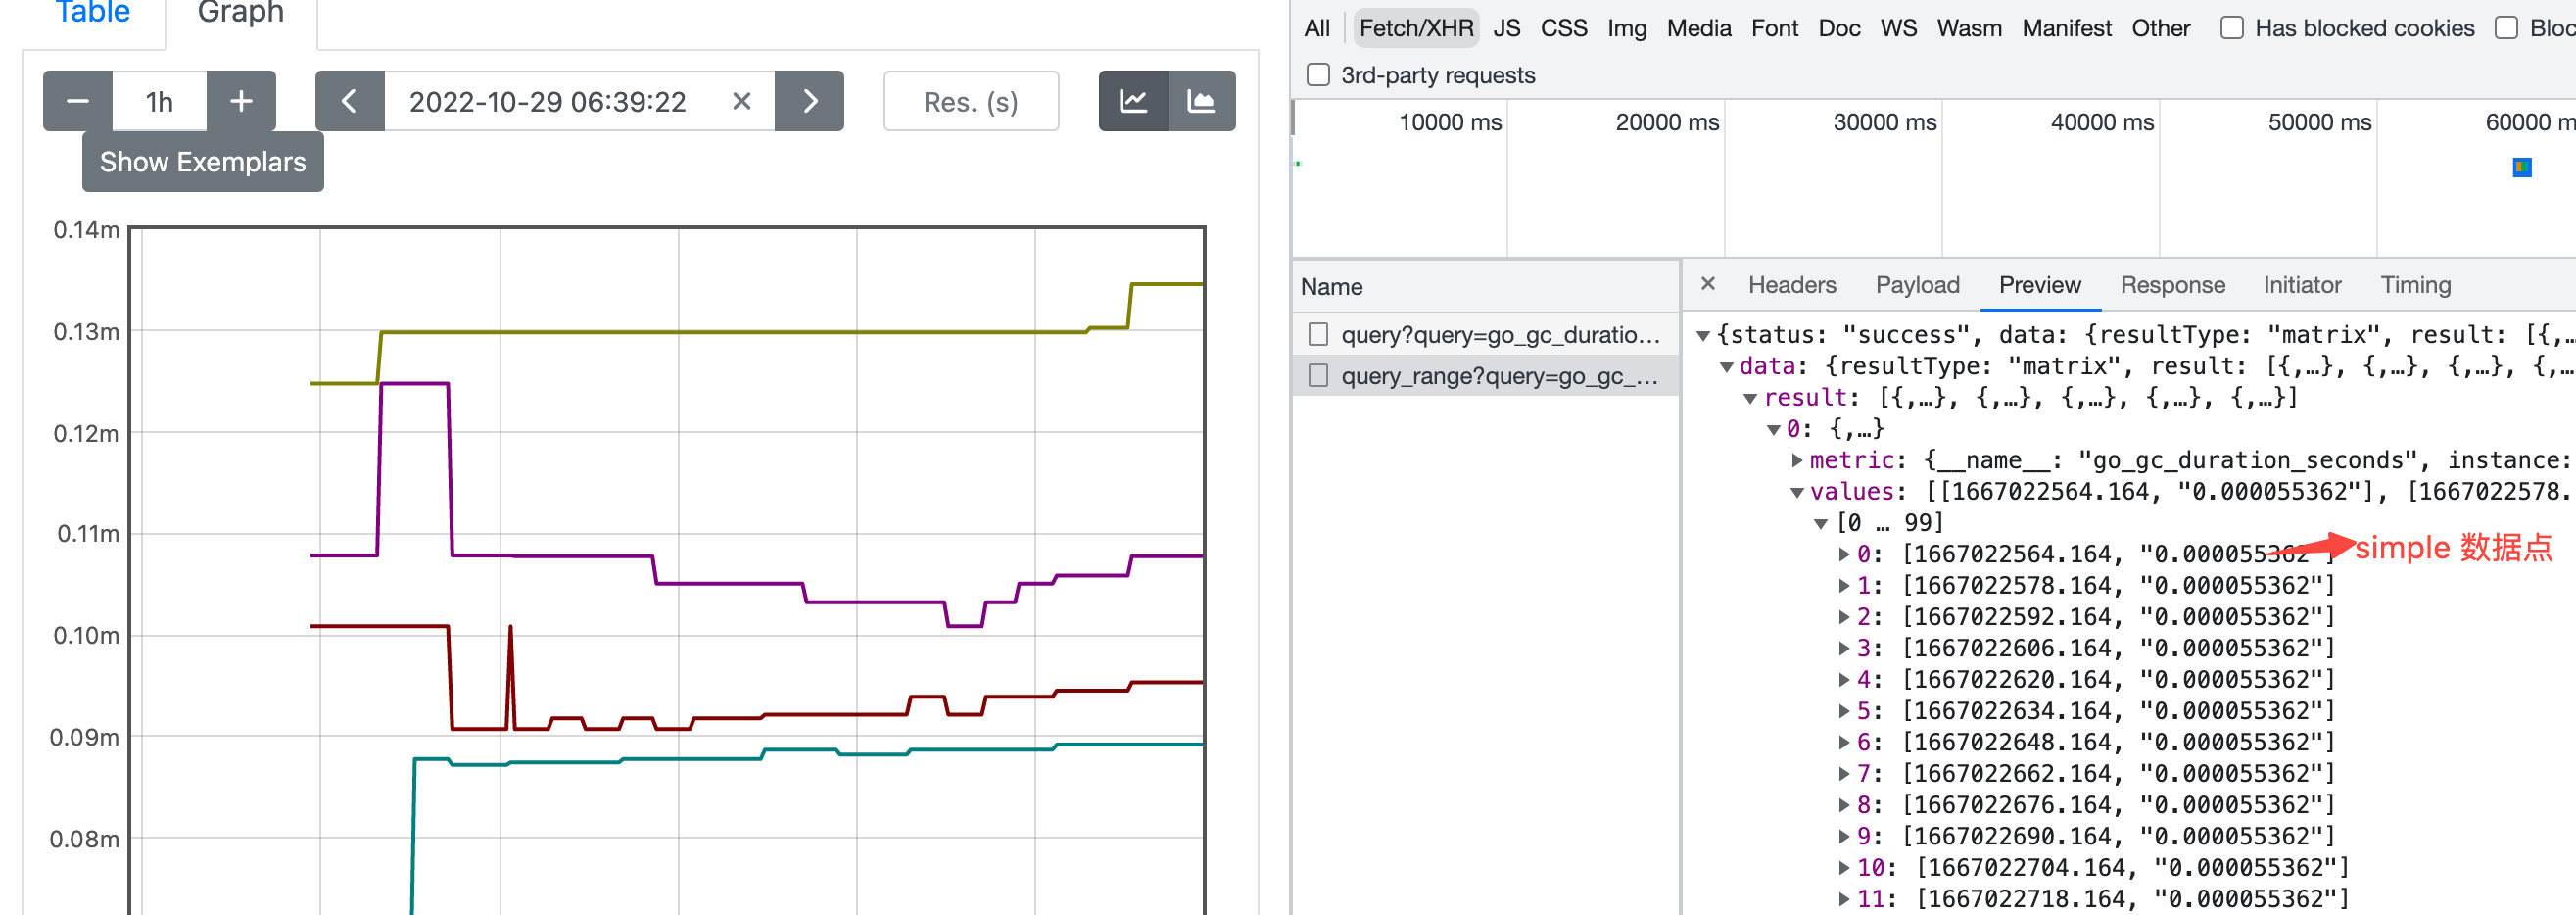
sample 数据点
时序曲线中的一个点
-
sample代表一个数据点
-
源码位置: promql/value.go
1// Sample is a single sample belonging to a metric.
2type Sample struct {
3   Point
4   Metric labels.Labels
5}
prometheus 时序序列
时间序列数据:按照时间顺序记录系统、设备状态变化的数据,每个数据称为一个样本;
- 数据采集以特定的时间周期进行,因而,随着时间流逝,将这些样本数据记录下来,将生成一个离散的样本数据序列;
- 该序列也称为向量(Vector);而将多个序列放在同一个坐标系内(以时间为横轴,以序列为纵轴),将形成一个由数据点组成的矩阵。
1  ^
2  │   . . . . . . . . . . . . . . . . .   . .   node_cpu{cpu="cpu0",mode="idle"}
3  │     . . . . . . . . . . . . . . . . . . .   node_cpu{cpu="cpu0",mode="system"}
4  │     . . . . . . . . . .   . . . . . . . .   node_load1{}
5  │     . . . . . . . . . . . . . . . .   . .
6  v
7    <------------------ 时间 ---------------->
在time-series中的每一个点称为一个样本(sample),样本由以下三部分组成: 指标(metric):metric name和描述当前样本特征的labelsets; 时间戳(timestamp):一个精确到毫秒的时间戳; 样本值(value): 一个float64的浮点型数据表示当前样本的值。
prometheus 四种查询类型
- 4种查询类型
- vector
- matrix
- scalar
- string
- instant query 对应vector
- range query 对应matrix
文档地址 源码位置:promql/parser/value.go
1// The valid value types.
2const (
3	ValueTypeNone   ValueType = "none"
4	ValueTypeVector ValueType = "vector"
5	ValueTypeScalar ValueType = "scalar"
6	ValueTypeMatrix ValueType = "matrix"
7	ValueTypeString ValueType = "string"
8)
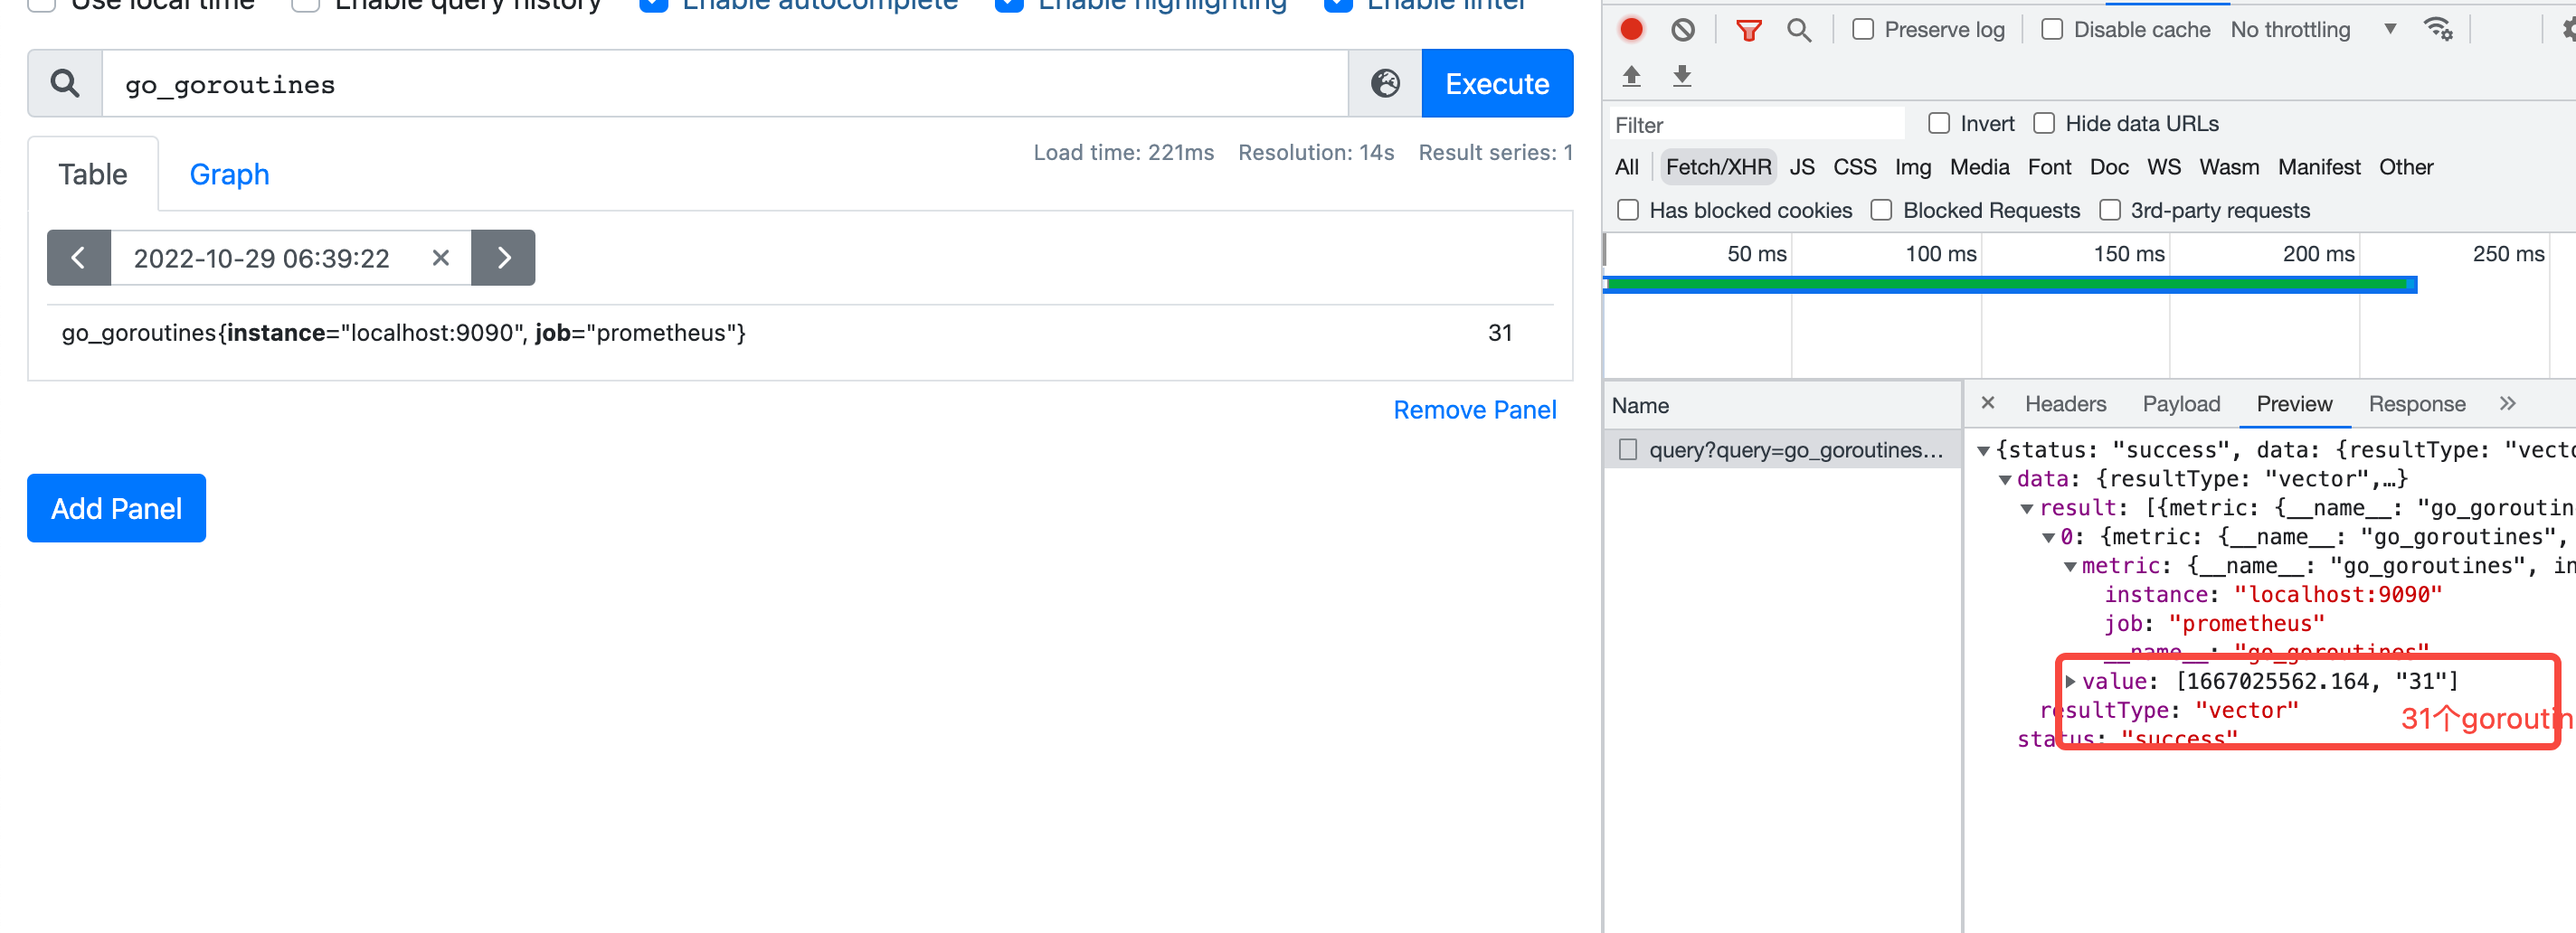
即时向量 Instant vector
一组时间序列,每个时间序列包含一个样本,所有样本共享相同的时间戳,好比某个时间,纵轴的数据
源码位置: promql/value.go
1// Vector is basically only an alias for model.Samples, but the
2// contract is that in a Vector, all Samples have the same timestamp.
3type Vector []Sample
vector 向量,是samples的别名,但是所有sample具有相同timestamp ,常用作instant_query的结果
在prometheus页面上就是table查询 ,对应查询接口 /api/v1/query
范围向量 Range vector
一组时间序列,一段时间的结果
在prometheus页面上就是graph查询 ,对应查询接口 /api/v1/query_range
返回的结果是Matrix 矩阵
源码位置: promql/value.go
 1// Matrix is a slice of Series that implements sort.Interface and
 2// has a String method.
 3type Matrix []Series
 4
 5
 6// Series is a stream of data points belonging to a metric.
 7type Series struct {
 8Metric labels.Labels `json:"metric"`
 9Points []Point       `json:"values"`
10}
series 是标签组+Points的组合
标量 Scalar
一个简单的数字浮点值
String
一个简单的字符串值;目前未使用
prometheus 四种标签匹配模式
4种查询类型
=等于!=不等于=~正则匹配!~正则非匹配
 1等于
 2go_gc_duration_seconds{quantile="0.75"}
 3
 4不等于
 5查询举例: 非lo网卡的接收字节数
 6node_network_receive_bytes_total{device!="lo"}
 7
 8正则匹配
 9查询: 挂载点以/run开头的文件系统剩余字节数  node_filesystem_avail_bytes{mountpoint=~"^/run.*"}
10查询:  prometheus_http_requests_total{handler=~"/api.*"}
11
12正则非匹配
13查询: 块设备名字不包含vda的读字节数  node_disk_read_bytes_total{device!~".*vda.*"}
14查询: prometheus_http_requests_total{code!~".*00"}
15
16
17`__name__` 也是个标签,可以匹配metrics
18go 开头还必须有 quantile 标签的
19查询  {__name__=~"go.*",quantile=~".*0.*"} 等价于 go_gc_duration_seconds{quantile=~".*0.*"}
prometheus 四种数据类型
- gauge 当前值 最简单,看标签
- counter 计数器 多用在请求计数,cpu统计
- histogram 直方图样本观测 :服务端算分位值
- summary 摘要:客户端算分位值
gauge 当前值
举例 go_info{instance=“localhost:9090”, job=“prometheus”, version=“go1.18.6”}
主要是看标签的key和value
counter 计数器
代表一个累积指标单调递增计数器
- 使用rate 查看qps rate(prometheus_http_requests_total[1m])
- 使用increase 查看增量 increase(prometheus_http_requests_total[3600s])
histogram 直方图样本观测
将时间范围的数据划分成不同的时间段,并各自评估其样本个数及样本值之和,因而可计算出分位数;
可用于分析因异常而引起的平均值过大的问题
分位数计算要使用转慢的histogram_quantile函数
以95分位值为例: 将采集到的100个数据,从小到大排列,95分位值就是取出第95个用户的数据做统计。 同理,50分位值就是第50个人的数据
 1# http所有接口 总的95分位值
 2# sum/count 可以算平均值
 3prometheus_http_request_duration_seconds_sum/ prometheus_http_request_duration_seconds_count
 4
 5# histogram_quantile(0.95, sum(rate(prometheus_http_request_duration_seconds_bucket[5m])) by (le,handler))
 6
 7histogram_quantile(0.95, sum(rate(prometheus_http_request_duration_seconds_bucket[1m])) by (le))
 8
 9# range_query接口的95分位值
10histogram_quantile(0.95, sum(rate(prometheus_http_request_duration_seconds_bucket{handler="/api/v1/query_range"}[5m])) by (le))
利用 sum/count 算平均值 :histogram 和summary 都适用
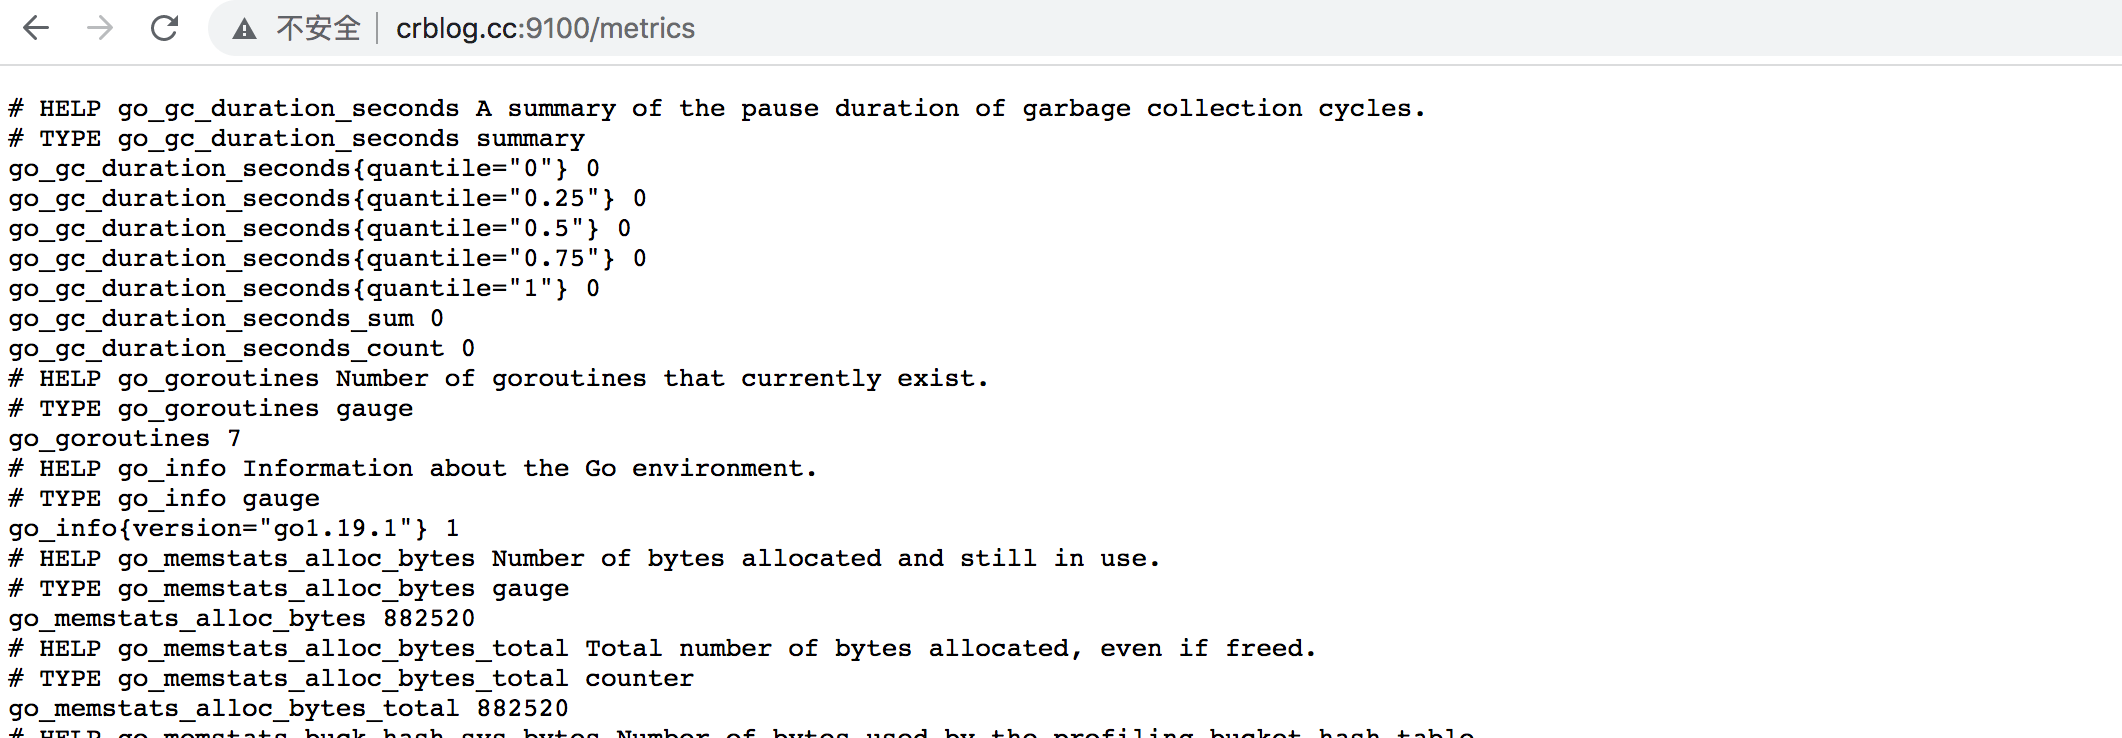
summary 摘要会采样观察值
类似 Histogram, 但客户端会直接计算上报分位数
- 通常是请求持续时间和响应大小之类的东西
- 尽管它还提供了观测值的总数和所有观测值的总和
 1# gc耗时
 2
 3# HELP go_gc_duration_seconds A summary of the pause duration of garbage collection cycles.
 4# TYPE go_gc_duration_seconds summary
 5go_gc_duration_seconds{quantile="0"} 0.000135743
 6go_gc_duration_seconds{quantile="0.25"} 0.000872805
 7go_gc_duration_seconds{quantile="0.5"} 0.000965516
 8go_gc_duration_seconds{quantile="0.75"} 0.001055636
 9go_gc_duration_seconds{quantile="1"} 0.006464756
10
11# summary 平均值
12go_gc_duration_seconds_sum /go_gc_duration_seconds_count
时间范围选择器
prometheus查询返回13位毫秒时间戳
范围向量选择器 Range Vector Selectors
- 范围矢量的工作方式与即时矢量一样,不同之处在于它们从当前即时中选择了一定范围的样本。语法上,将持续时间附加在[]向量选择器末尾的方括号()中,以指定应为每个结果范围向量元素提取多远的时间值。
- 只能作用在
counter上
持续时间指定为数字,紧随其后的是以下单位之一:
- s - 秒
- m - 分钟
- h - 小时
- d - 天
- w - 周
- y - 年 在此示例中,我们选择在过去 5 分钟,数据指标名称为http_requests_total且job标签为prometheus的所有时间序列记录的所有值:
1http_requests_total{job="prometheus"}[5m]
时间范围 ,不能低于采集间隔
时间范围不能脱离rate等函数,不然会报错
1Error executing query: invalid expression type "range vector" for range query, must be Scalar or instant Vector
PromQL简单总结
PromQL(Prometheus Query Language)是 Prometheus 内置的数据查询语言,它能实现对事件序列数据的查询、聚合、逻辑运算等。它并且被广泛应用在 Prometheus 的日常应用当中,包括对数据查询、可视化、告警处理当中。
简单地说,PromQL 广泛存在于以 Prometheus 为核心的监控体系中。所以需要用到数据筛选的地方,就会用到 PromQL。例如:监控指标的设置、报警指标的设置等等。
举例
去掉/保留 label
- 去掉有code标签的:
sum without(code) (rate(prometheus_http_requests_total[2m] ) ) - 保留举例:
sum by(code) (rate(prometheus_http_requests_total[2m] ) )
topk、bottomk
- 举例:查看容器cpu使用率top5
topk(5,prometheus_http_response_size_bytes_bucket) - 最小的 bottomk(5,prometheus_http_response_size_bytes_bucket)
同环比 相减
qps 同环比1小时
- sum (rate(prometheus_http_requests_total[2m] offset 1h) ) - sum (rate(prometheus_http_requests_total[2m] ) )
absent nodata报警
- ==1代表absent生效
- 举例:
absent(abc_def)==1
分位值histogram_quantile
举例查看apiserver 请求延迟90分位
histogram_quantile(0.90, sum(rate(prometheus_http_request_duration_seconds_bucket[5m])) by (le))
两组series关联 成功率百分比
举例:apiserver 请求成功率
100* ( sum(prometheus_http_requests_total{code=~"2.*|3.*"})/ sum(prometheus_http_requests_total) )
agg_over_time 给所有ts的value做agg
横向agg (agg 就是 avg、sum等聚合函数)
查看一天平均goutine数 avg_over_time(go_goroutines [24h])
查看一天sum等gouyine数 sum_over_time(go_goroutines [24h])
node exporter
1wget https://github.com/prometheus/node_exporter/releases/download/v1.4.0/node_exporter-1.4.0.linux-amd64.tar.gz
2tar zxvf node_exporter-1.4.0.linux-amd64.tar.gz
3mv node_exporter-1.4.0.linux-amd64/node_exporter /usr/local/bin/
4node_exporter --help
5# ./node_exporter --web.listen-address 127.0.0.1:8080
6# 直接运行默认9100端口
7localhost:9100/metrics
1groupadd node_exporter
2useradd -g node_exporter -M -s /sbin/nologin node_exporter
添加node_exporter.service
 1[Unit]
 2Description=Node exporter server
 3After=network-online.target
 4[Service]
 5# 账户和组设置,可以保证数据安全
 6User=node_exporter
 7Type=simple
 8ExecStart=/usr/local/bin/node_exporter
 9StandardOutput=syslog
10StandardError=syslog
11SyslogIdentifier=node_exporter
12Restart=on-failure
13RestartSecs=5s
14ExecReload=/bin/kill -HUP $MAINPID
15[Install]
16WantedBy=multi-user.target
1systemctl daemon-reload
2systemctl enable  node_exporter#开机启动
3systemctl start node_exporter
prometheus配置文件
 1# my global config
 2global:
 3  scrape_interval: 15s # Set the scrape interval to every 15 seconds. Default is every 1 minute.
 4  evaluation_interval: 15s # Evaluate rules every 15 seconds. The default is every 1 minute.
 5  # scrape_timeout is set to the global default (10s).
 6
 7# Alertmanager configuration
 8alerting:
 9  alertmanagers:
10    - static_configs:
11        - targets:
12          # - alertmanager:9093
13
14# Load rules once and periodically evaluate them according to the global 'evaluation_interval'.
15rule_files:
16  # - "first_rules.yml"
17  # - "second_rules.yml"
18
19# A scrape configuration containing exactly one endpoint to scrape:
20# Here it's Prometheus itself.
21scrape_configs:
22  # The job name is added as a label `job=<job_name>` to any timeseries scraped from this config.
23  - job_name: "prometheus"
24
25    # metrics_path defaults to '/metrics'
26    # scheme defaults to 'http'.
27
28    static_configs:
29      - targets: ["localhost:9090"]
30  - job_name: "nodes"
31    static_configs:
32      - targets:
33        - locahost:9100
34        #- ip2:9100
cpu使用率指标如何查看
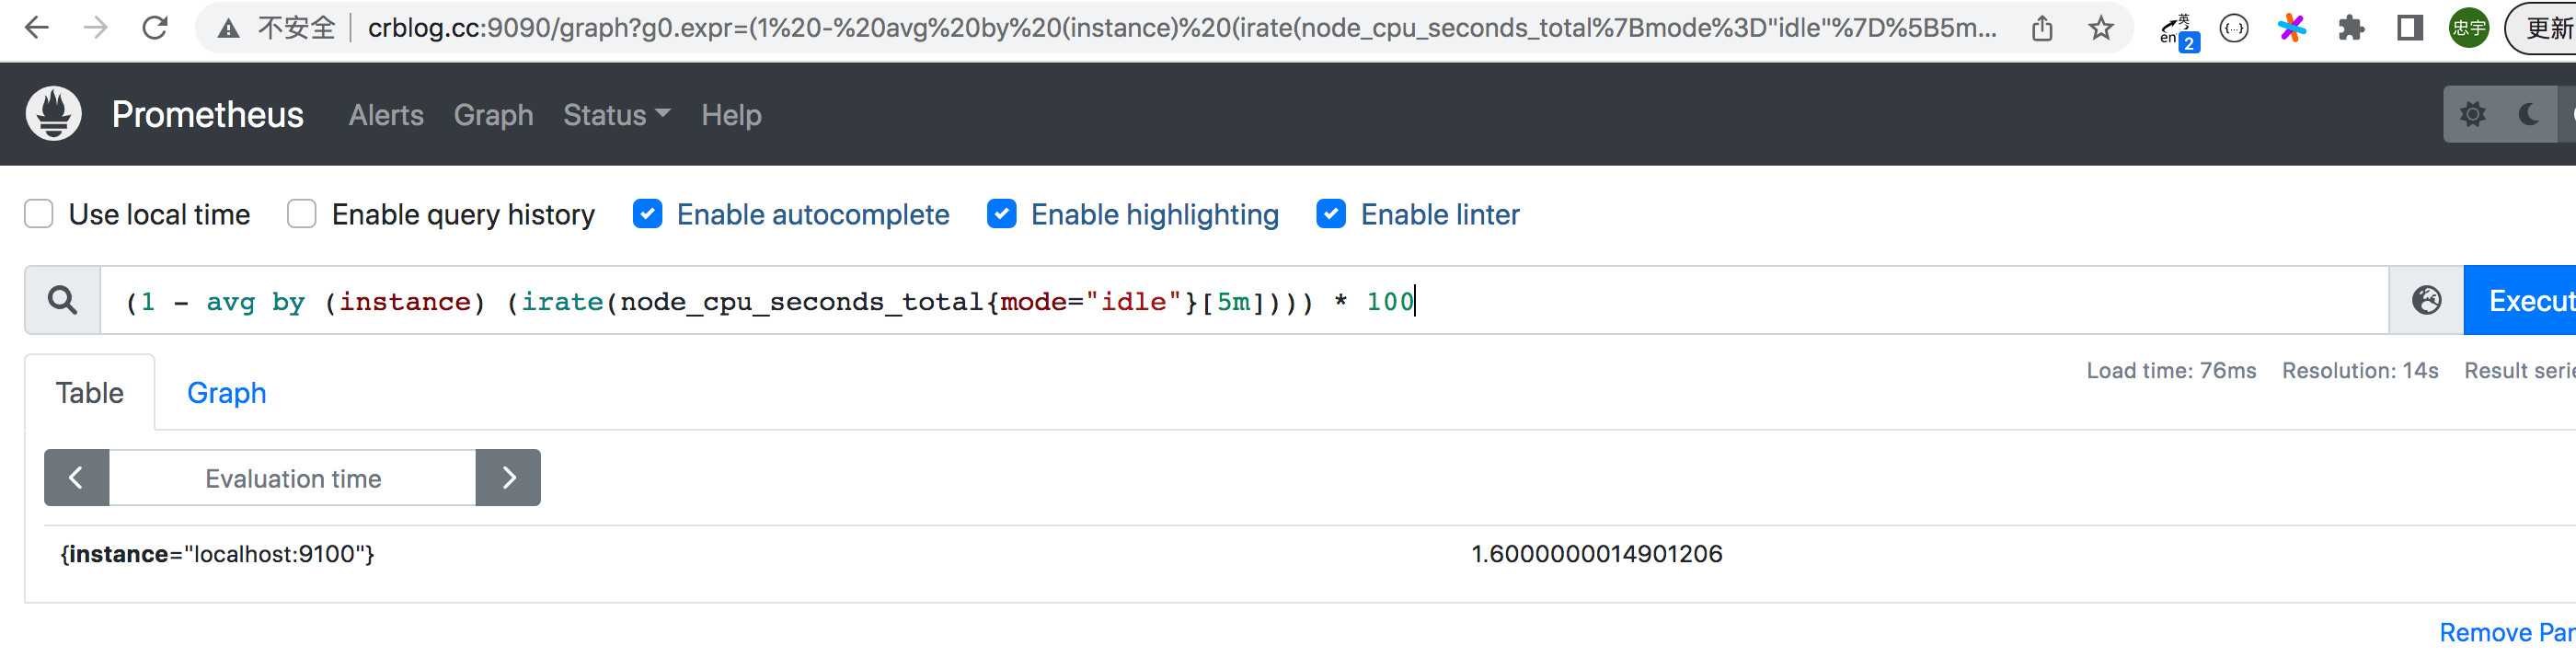
1# 计算cpu 5分钟内的使用率  1- idle空闲的    * 100 就是百分比, install 是实例
2(1 - avg by (instance) (irate(node_cpu_seconds_total{mode="idle"}[5m]))) * 100
3下图就是  5分钟 百分之 1.6的使用率
cpu饱和度
跟踪cpu的平均负载就能获取到相关的cpu饱和度,实际上,它是将主机的cpu数量考虑在内的一段时间内,平均运行队列长度
- 平均负载少于cpu的数量是正常的,而长时间超过cpu数量则表示cpu已经饱和
- node_load1 > on (instance) 2 * count(node_cpu_seconds_total{mode=“idle”}) by (instace)
- 查看1分钟平均负载超过主机核心数2倍的时间序列 (我这里结果是空)
内存使用率
node_exporter 暴露了多个以node_memory 为前缀的指标,我们注重如下几个指标
- node_memory_MemTotal_bytes
- node_memory_MemFree_bytes
- node_memory_Buffers_bytes
- node_memory_Cached_bytes
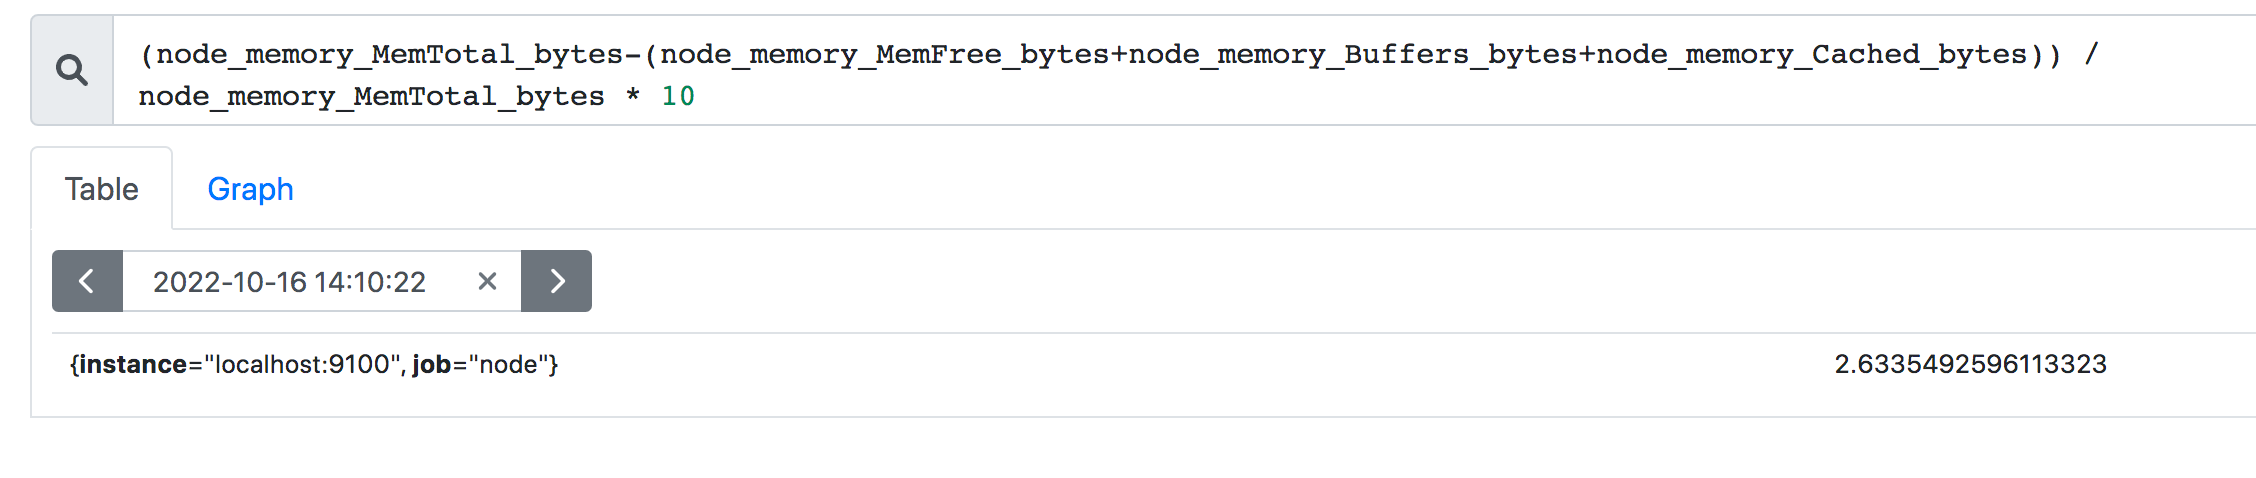
可用空间:node_memory_MemFree_bytes+node_memory_Buffers_bytes+node_memory_Cached_bytes 已用空间: node_memory_MemTotal_bytes - 上面的可用空间 使用率: 已用空间除以总空间
(node_memory_MemTotal_bytes-(node_memory_MemFree_bytes+node_memory_Buffers_bytes+node_memory_Cached_bytes)) / node_memory_MemTotal_bytes * 10
mysqld_exporter
下载
1wget https://github.com/prometheus/mysqld_exporter/releases/download/v0.14.0/mysqld_exporter-0.14.0.linux-amd64.tar.gz
2tar zxvf mysqld_exporter-0.14.0.linux-amd64.tar.gz
3mv mysqld_exporter-0.14.0.linux/mysqld_exporter /usr/local/bin/
添加mysqld_exporter连接用户
别用root。
1 grant select,replication client,process ON *.* to 'mysql_monitor'@'localhost' identified by '123';
2 flush privileges;
配置文件
/etc/mysqld_exporter.cnf
1[client]
2user=mysql_monitor
3password=123
启动
1/usr/local/bin/mysqld_exporter --config.my-cnf="/etc/mysqld_exporter.cnf"
搞成服务
mysqld_exporter.service
 1[Unit]
 2Description=Node exporter server
 3After=network-online.target
 4[Service]
 5# 账户和组设置,可以保证数据安全
 6User=mysql
 7Type=simple
 8ExecStart=/usr/local/bin/mysqld_exporter  --config.my-cnf="/etc/mysqld_exporter.cnf"
 9ExecReload=/bin/kill -HUP $MAINPID
10[Install]
11WantedBy=multi-user.target
prometheus 配置添加 job
 1scrape_configs:
 2  - job_name: "prometheus"
 3    static_configs:
 4      - targets: ["localhost:9090"]
 5  - job_name: "node"
 6    static_configs:
 7      - targets:
 8         - localhost:9100
 9  - job_name: "mysqld"
10    static_configs:
11      - targets:
12         - localhost:9104
1systemctl restart prometheus.service
grafana
Grafana是一个开源的度量分析和可视化工具,可以通过将采集的数据分析,查询,然后进行可视化的展示,并能实现报警。
下载地址: https://grafana.com/grafana/download/9.1.0?platform=linux&edition=oss
安装
用oss, 不用Enterprise
 1wget https://dl.grafana.com/oss/release/grafana-9.1.0.linux-amd64.tar.gz
 2tar -zxvf grafana-9.1.0.linux-amd64.tar.gz
 3
 4# or  因为我是ubuntu系统 我用的下面这个
 5
 6sudo apt-get install -y adduser libfontconfig1
 7wget https://dl.grafana.com/oss/release/grafana_9.1.0_amd64.deb
 8sudo dpkg -i grafana_9.1.0_amd64.deb
 9
10systemctl start grafana-server.service
11# 访问地址 http://ip:3000
12# 默认账户:admin    密码: admin
添加数据源 prometheus
add datasource
选择 prometheus
URL 填写 promethus_host:9090
METHOD 选择GET 其他不变
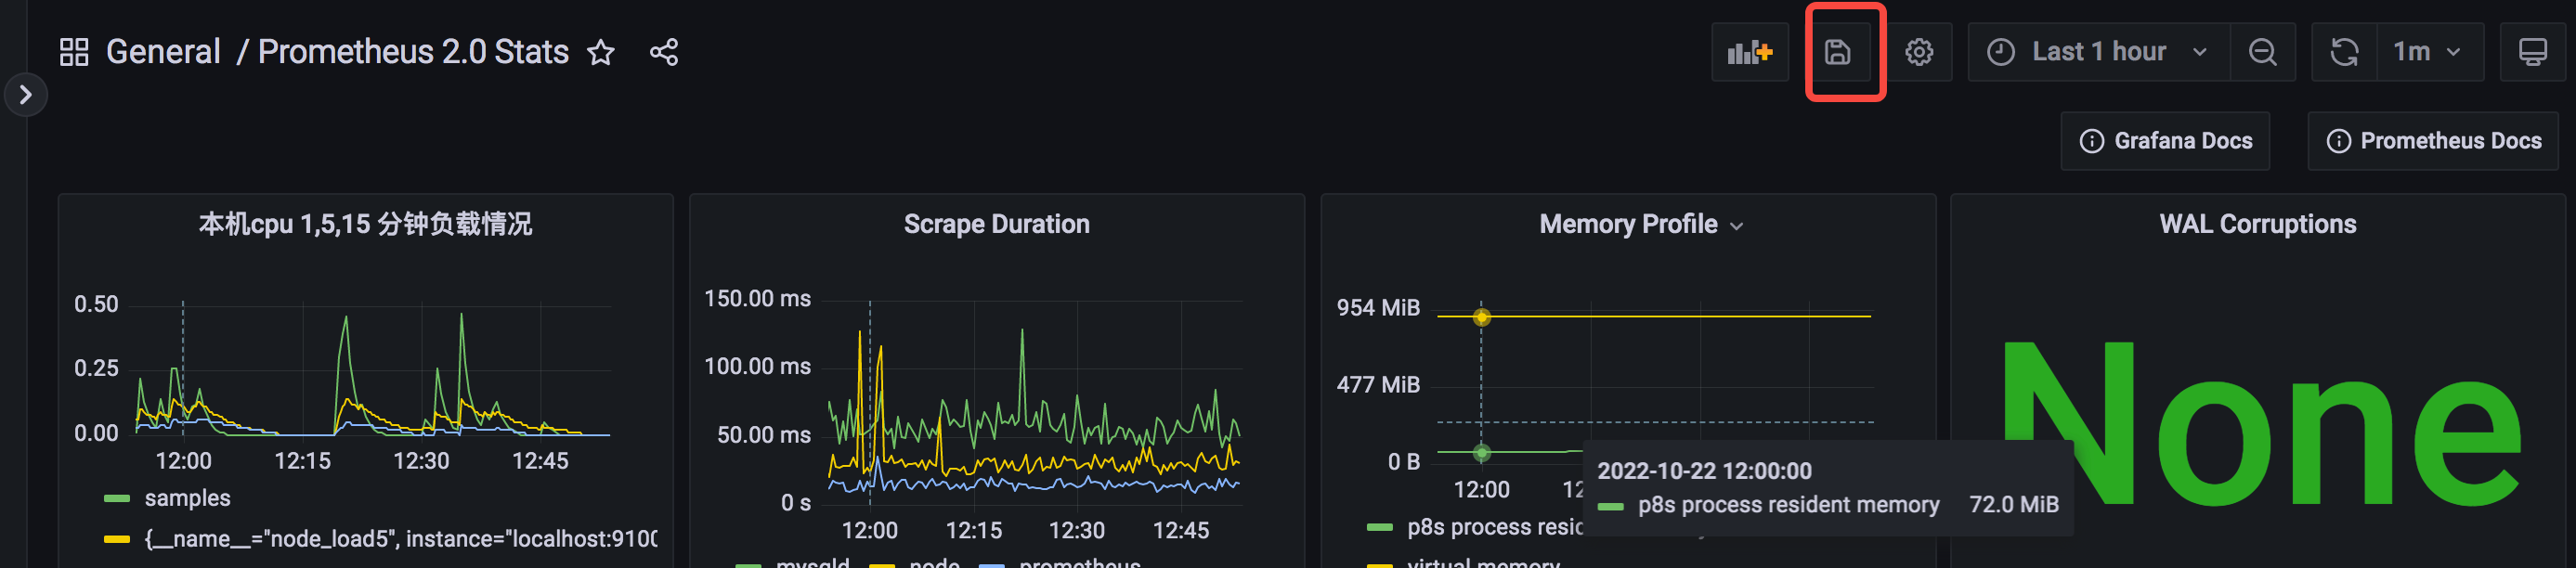
添加默认prometheus dashboard
在这基础上改一下,会很方便。
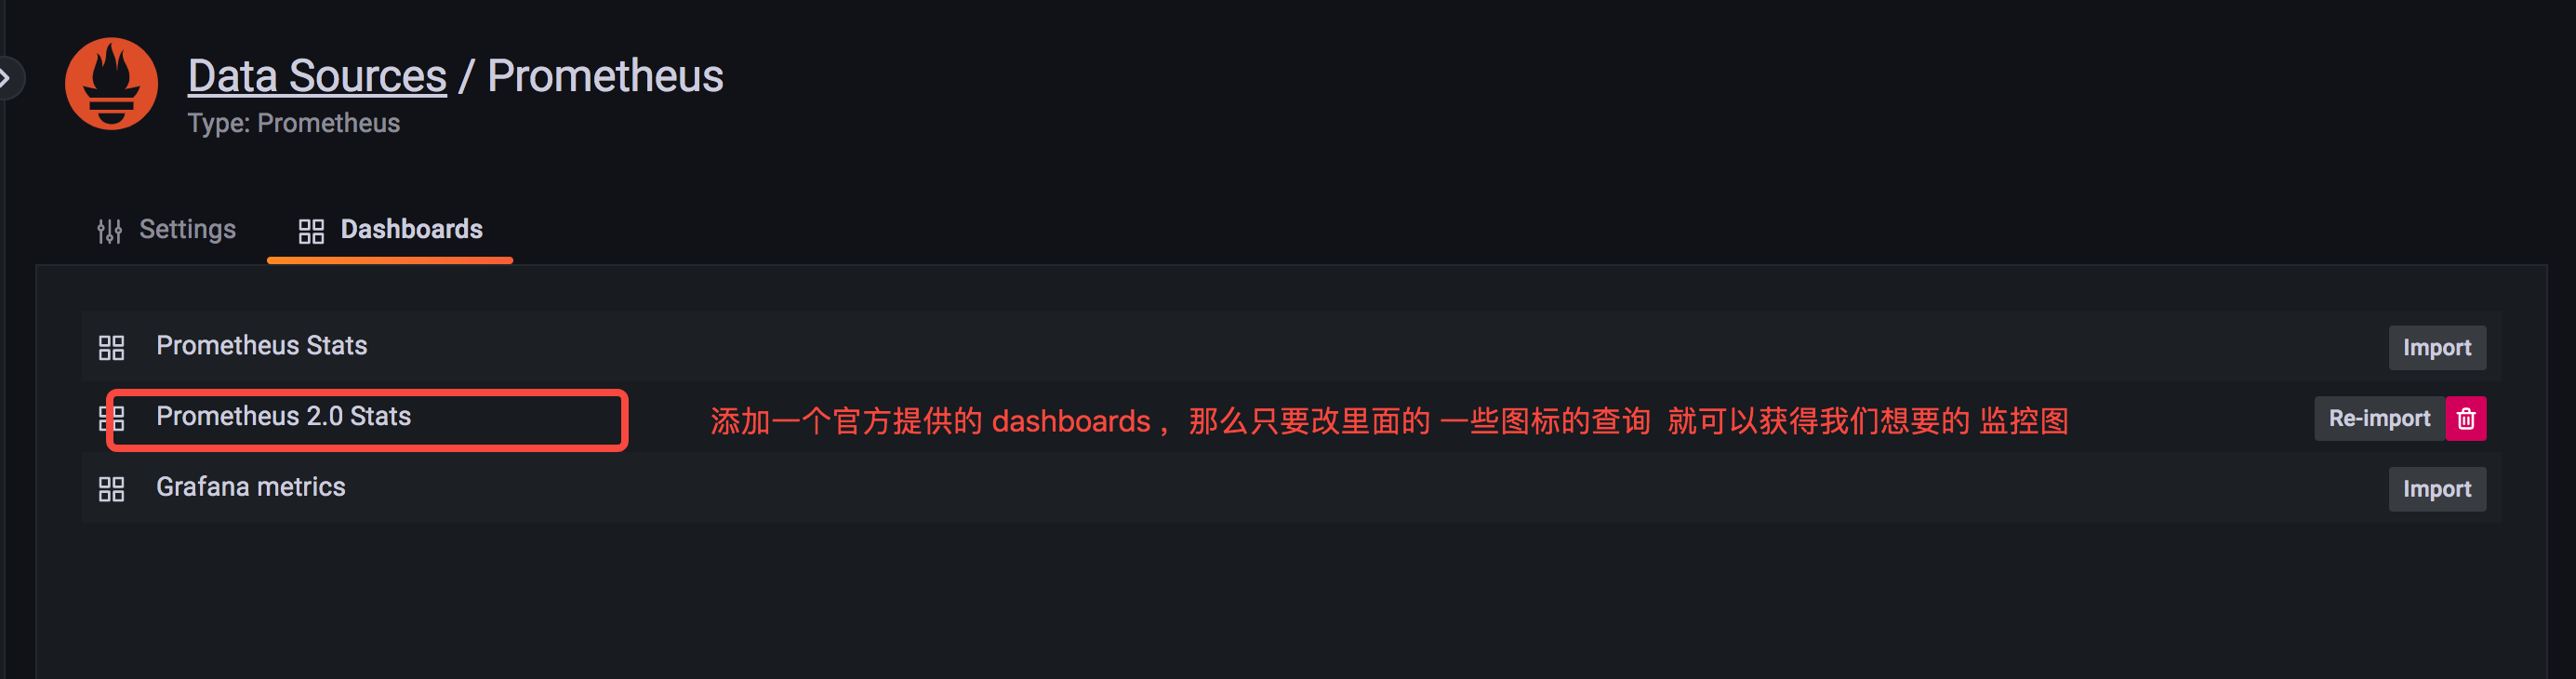
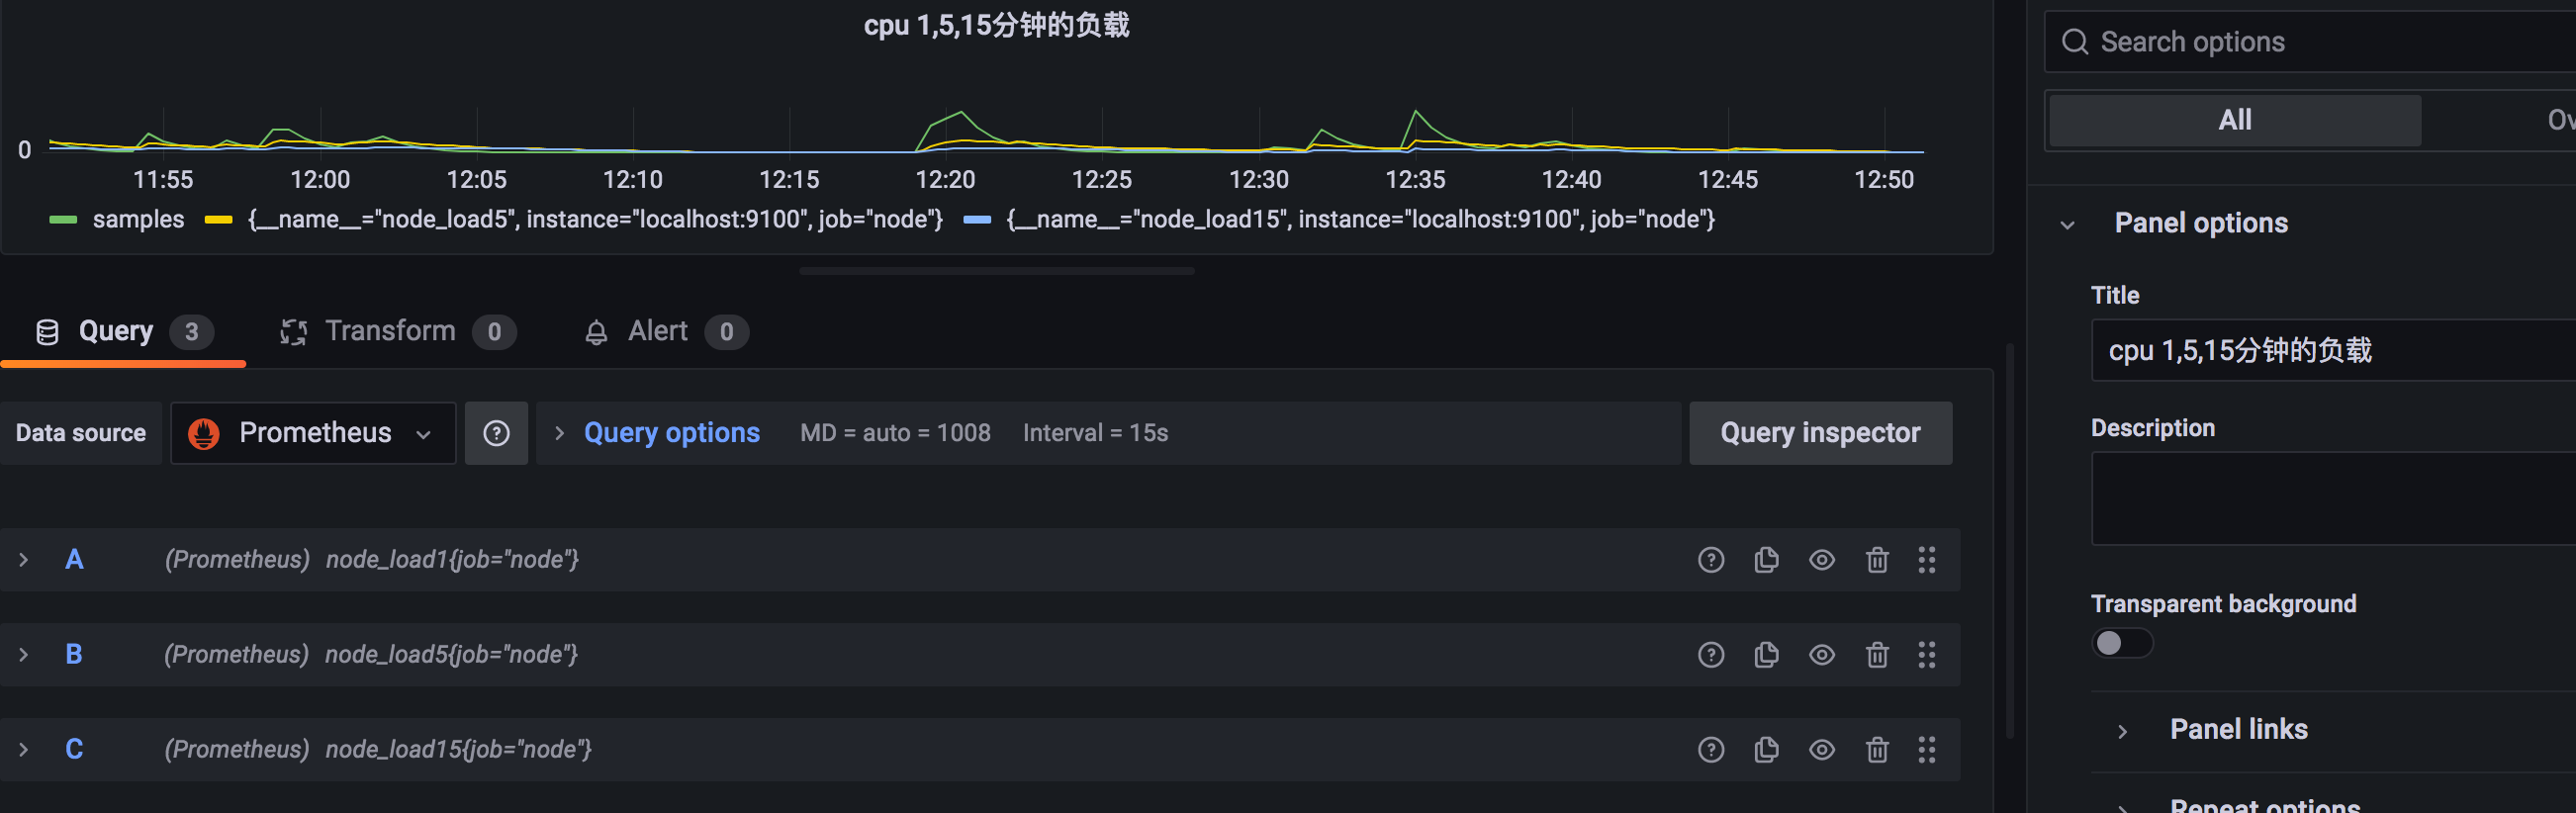
PS:chart和dashboard都要保存
使用第三方提供的json来展示mysql实例情况
自己写可能很废时间,专业的事情专业的人干,用第三方就是快速实现想要的监控数据。
https://github.com/percona/grafana-dashboards
导入这个json文件到 grafana 会产生一个 “MySQL Instances Overview” dashboard
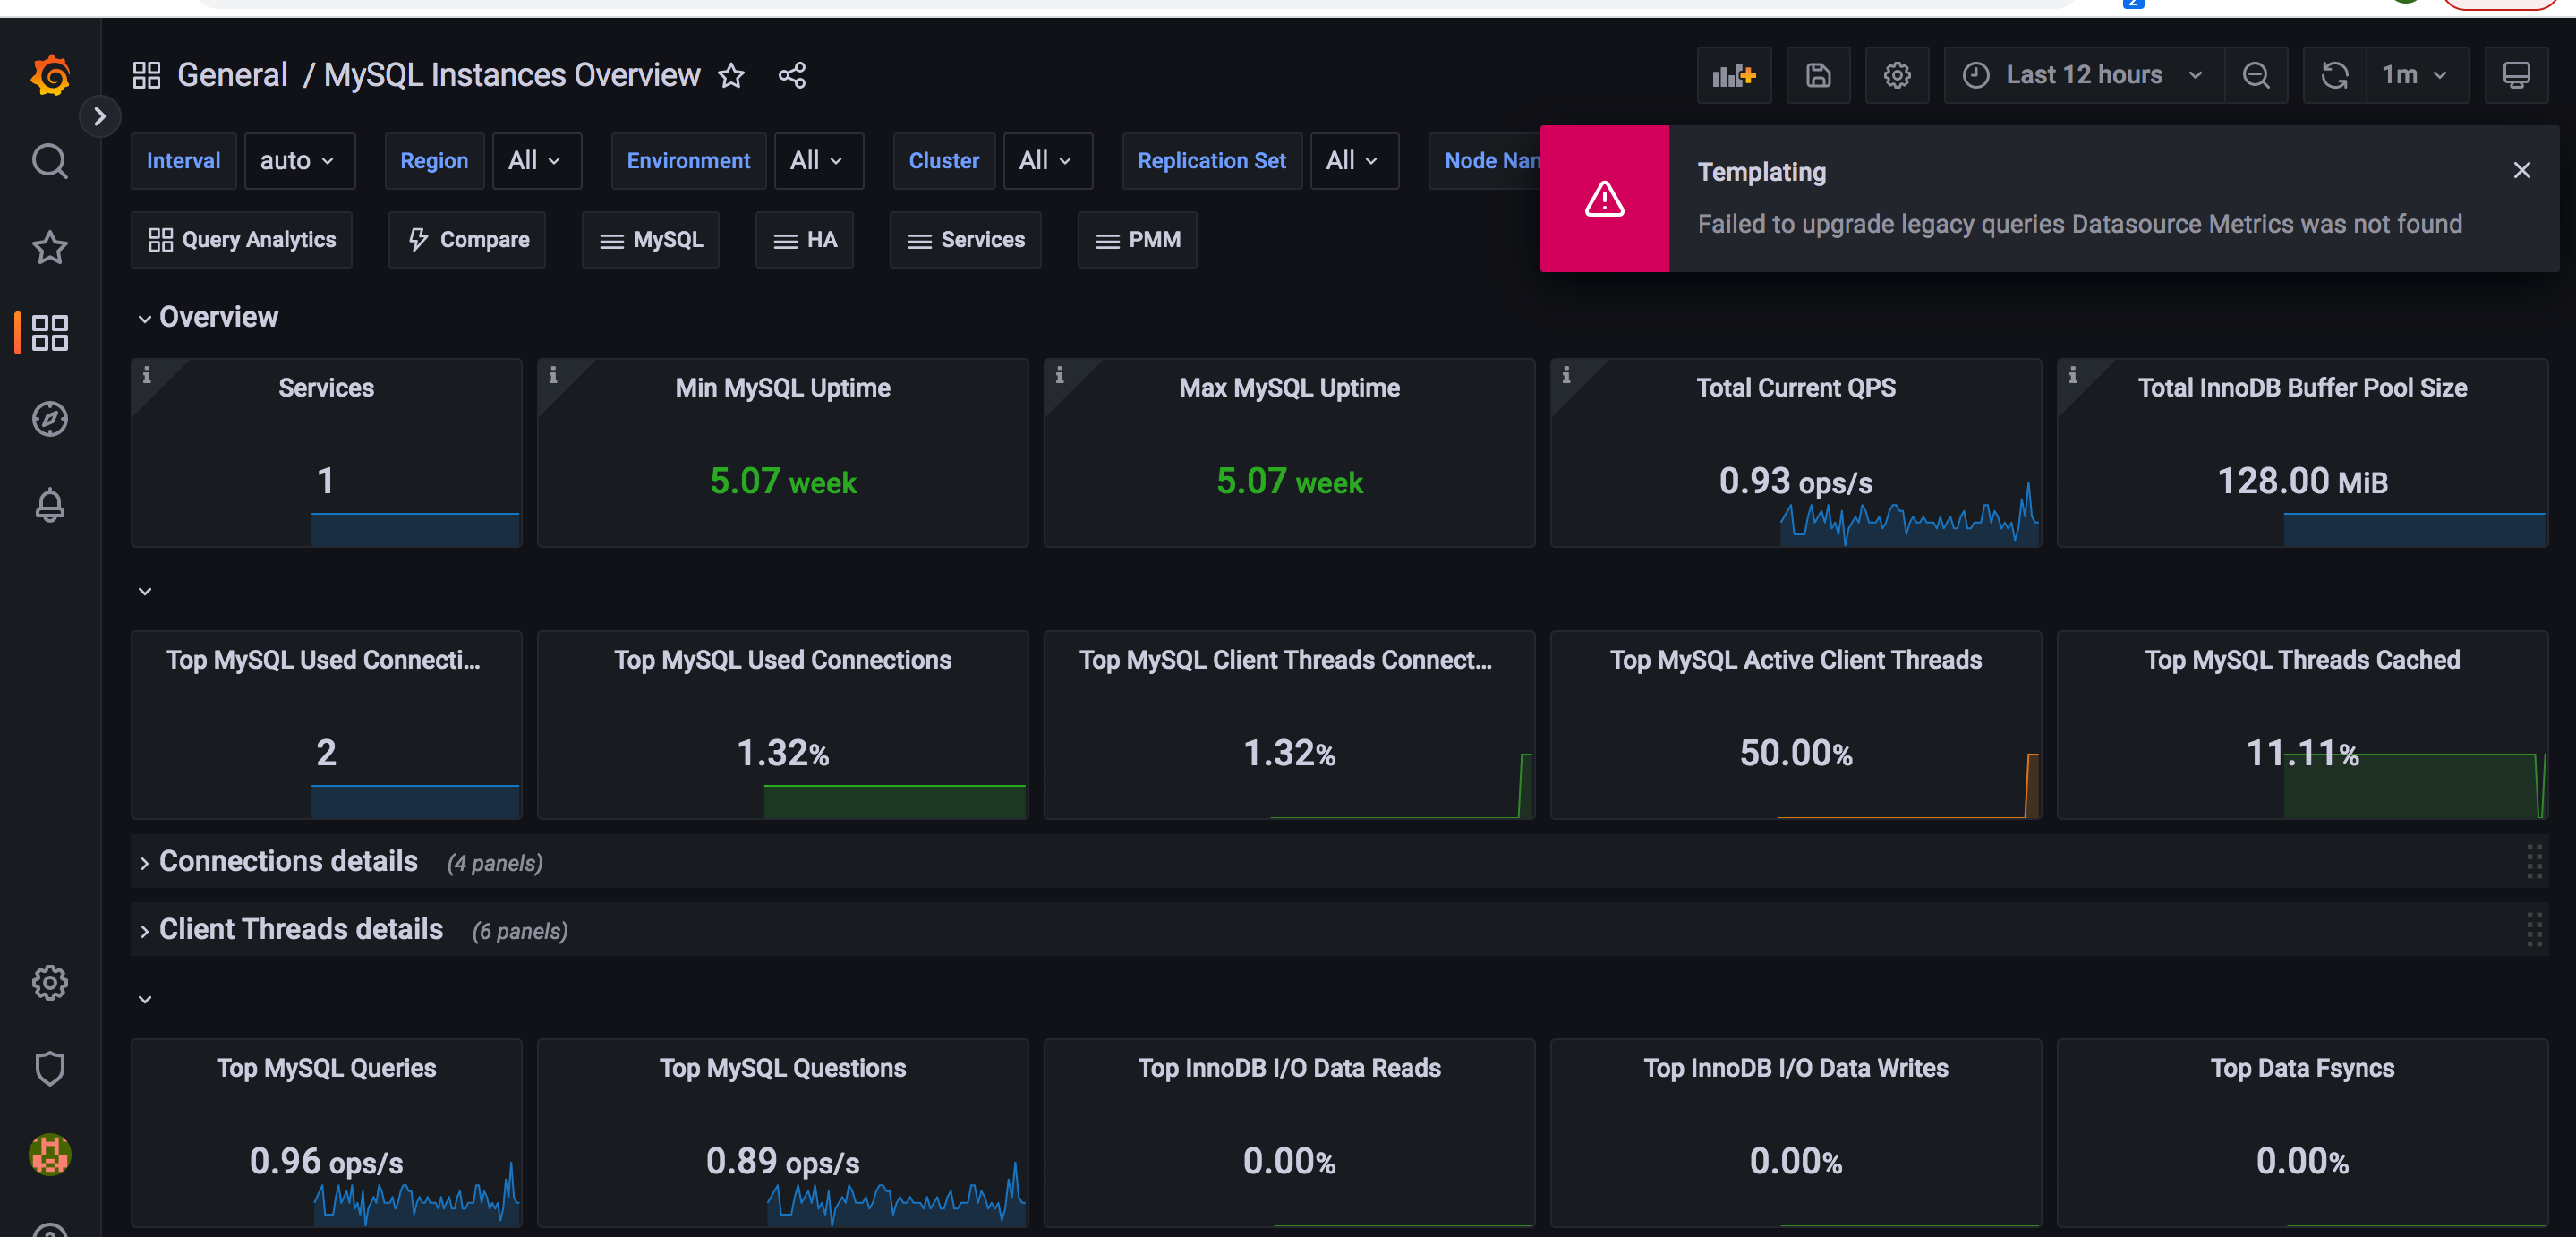
数据源名称不对。 重新修改这个json 文件。
1"datasource": "Metrics", =》 "datasource": "Prometheus" Prometheus你的数据源名称,未必就是 Prometheus ,我自己设置的是 Prometheus
还会报一个插件没安装的错误,无法展示一个图形。那就安装这个插件
这个依赖 https://grafana.com/grafana/plugins/grafana-polystat-panel/?tab=installation 这个插件 ,装上重启 grafana
1grafana-cli plugins install grafana-polystat-panel
2systemctl restart grafana-server.service