一个报表可视化工具,可以不需要写界面了,根据表数据快速实现你想要的图形展示
目前公司的bi报表就是通过这个实现的, 比起以前还要手写前端界面,和后端接口,要快速很多。
docker快速安装
1sudo docker run -d -p 8988:8088 -v /opt/docker/superset:/home/superset -v /var/lib/superset:/var/lib/superset amancevice/superset
初始化superset
1docker exec -it `container_id` /bin/bash # 进入容器
2superset db upgrade
3superset init
设置管理员账户
1export FLASK_APP=superset
2flask fab create-admin
用户名 mao 密码:123456
一些概念
这个系统是基于sqlite作为数据库实现的,用python flask 开发
-
data 添加数据库,如连上mysql
-
dataset 选择连上数据库的表
-
如果表里面一些字段需要通过sql处理过, 那么通过sql 的方式 去生成一个dataset 如下示例
1select STR_TO_DATE(install_day, '%Y-%m-%d') `date`, 2 app_name app, country, cost, revenue, installs, max_installs, 3 SUBSTRING_INDEX(retention_day_x, ',', 1) retention_day_0, 4 SUBSTRING_INDEX(SUBSTRING_INDEX(retention_day_x, ',', 2), ',', -1) retention_day_1, 5 SUBSTRING_INDEX(SUBSTRING_INDEX(retention_day_x, ',', 3), ',', -1) retention_day_2, 6 SUBSTRING_INDEX(SUBSTRING_INDEX(retention_day_x, ',', 4), ',', -1) retention_day_3, 7 SUBSTRING_INDEX(SUBSTRING_INDEX(retention_day_x, ',', 5), ',', -1) retention_day_4, 8 SUBSTRING_INDEX(SUBSTRING_INDEX(retention_day_x, ',', 6), ',', -1) retention_day_5, 9 SUBSTRING_INDEX(SUBSTRING_INDEX(retention_day_x, ',', 7), ',', -1) retention_day_6, 10 SUBSTRING_INDEX(SUBSTRING_INDEX(retention_day_x, ',', 8), ',', -1) retention_day_7, 11 SUBSTRING_INDEX(SUBSTRING_INDEX(retention_day_x, ',', 9), ',', -1) retention_day_10, 12 SUBSTRING_INDEX(SUBSTRING_INDEX(retention_day_x, ',', 10), ',', -1) retention_day_14, 13 SUBSTRING_INDEX(retention_day_x, ',', -1) retention_day_30, 14 from ( 15 select install_day, app_name, country, cost, revenue, installs, max_installs, 16 retention_day_x from overview_data m 17 join app_info a on m.app = a.app 18 ) t -
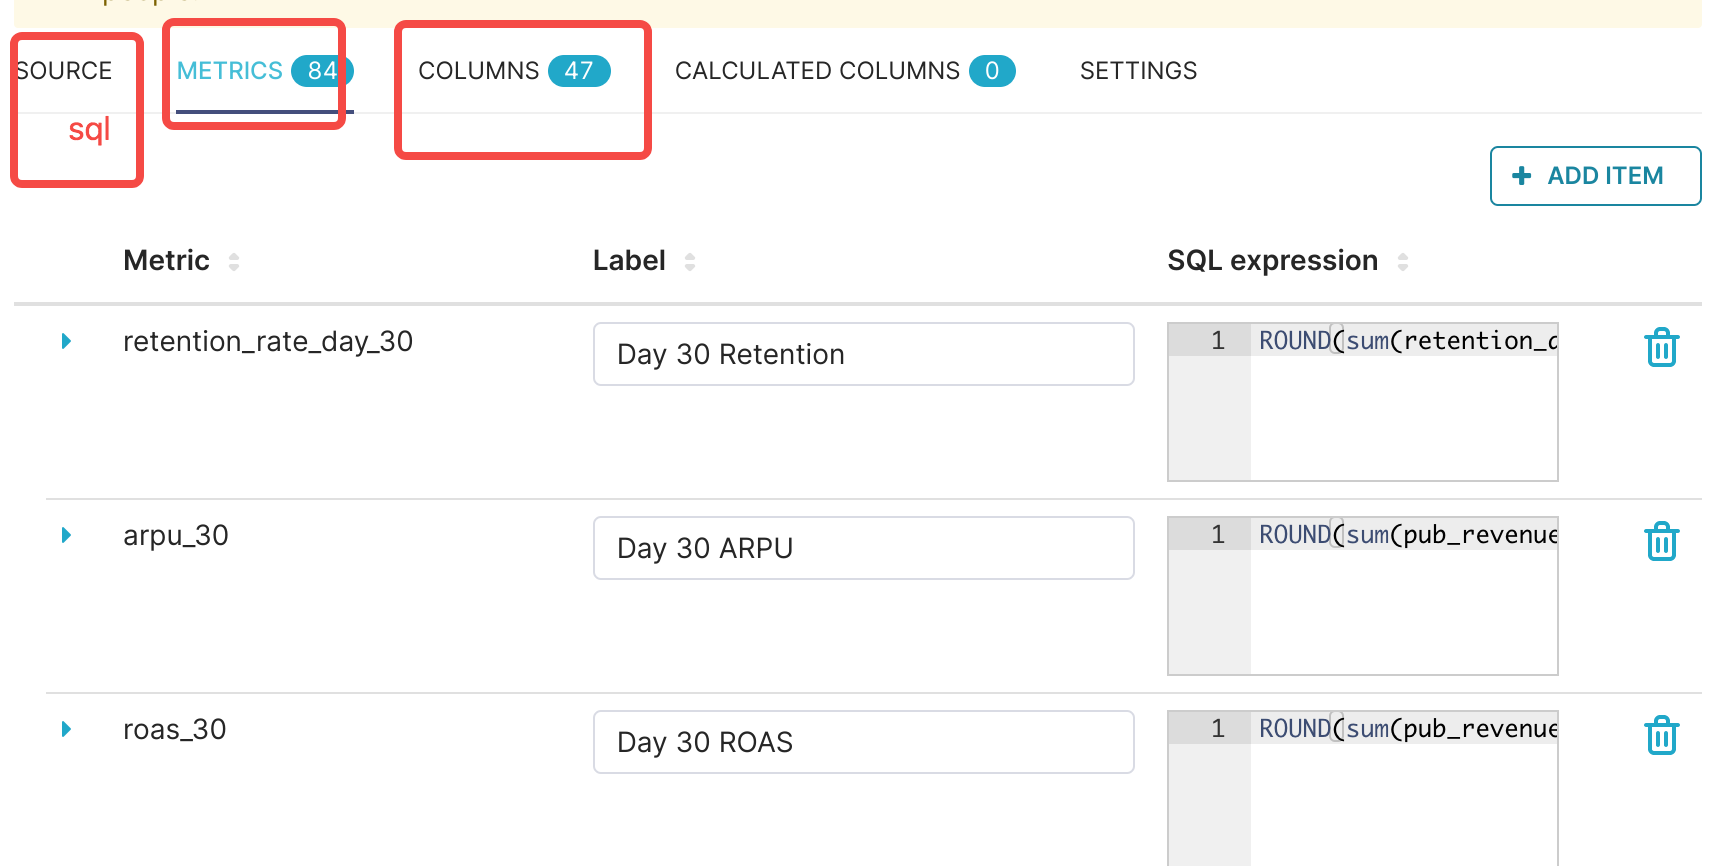
编辑dataset, 可以手动添加 metrics,columns 前提 你的source 里的sql 要查出来, metrics你可以用一些mysql 函数处理
- chaset 选择一个dataset ,选择报表类型 ,保存的时候选择dashboard 即可
superset 常用表,也许你想要快速 通过脚本改 表实现你想要的功能
前提你要对他的源码,如何实现的有一定的了解,不然容易改错,记得备份他的superset.db
slices表 存储chartsql_metrics存储自建指标- (修改单位格式化样式 d3format字段)
dashboards概览dashboard_slices概览和chart的关联表